A1C to Blood Sugar Conversion Chart With eAG and Formula
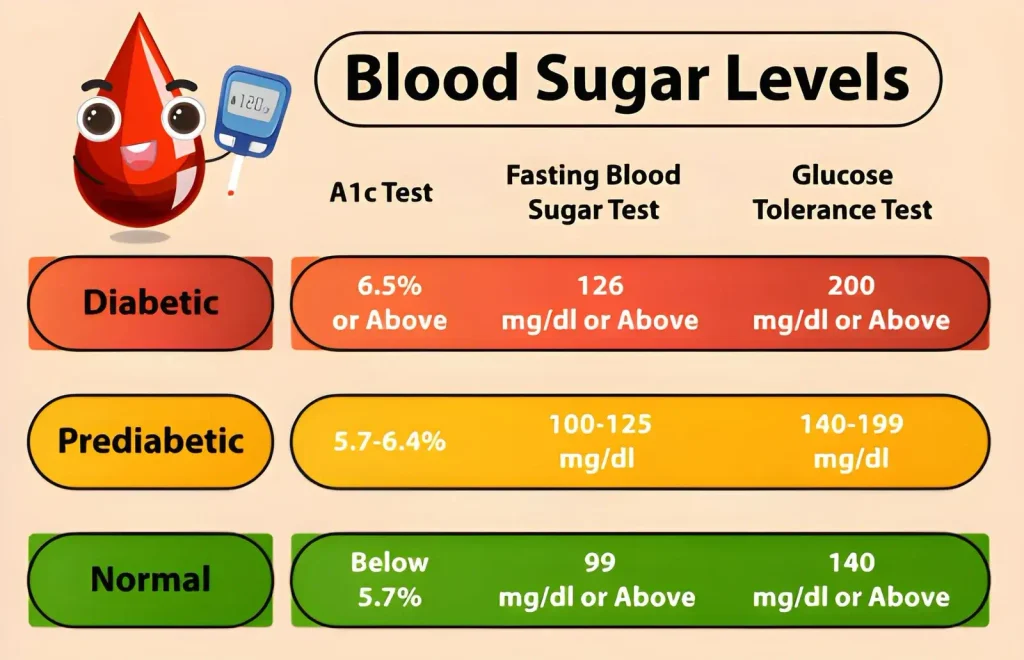
An A1C to blood sugar conversion chart turns your A1C percentage into an estimated average glucose, called eAG, in the same units your glucose meter uses. The formula is eAG (mg/dL) = 28.7 × A1C − 46.7. An A1C of 5.7 percent equals about 117 mg/dL, 6 percent equals 126 mg/dL, 7 percent equals 154 mg/dL, 8 percent equals 183 mg/dL, and 9 percent equals 212 mg/dL. Each 1 point rise in A1C adds about 29 mg/dL to your average blood sugar. An A1C below 5.7 percent is normal, 5.7 to 6.4 percent is prediabetes, and 6.5 percent or higher is diabetes.
What Is eAG and How Does It Relate to A1C?
eAG stands for estimated average glucose. It shows your A1C result as an average blood sugar number in mg/dL, the same unit you see on a home glucose meter. A1C itself is a percentage that shows how much sugar is attached to your red blood cells. Because red blood cells live about three months, A1C reflects your average blood sugar over the past two to three months.
Many people find a percentage hard to picture. An A1C of 7 percent means little on its own, but an average blood sugar of 154 mg/dL is easy to compare with your daily readings. That is why the American Diabetes Association began reporting eAG alongside A1C. Many lab reports now list both numbers so patients can understand their results without doing any math.
The eAG formula comes from the A1C Derived Average Glucose study, published in 2008. Researchers tracked more than 500 people with and without diabetes, checked their blood sugar many times a day for three months, and compared the results with their A1C. The study found a steady, straight line link between A1C and average blood sugar, which became the conversion formula labs use today.
A1C to Blood Sugar Conversion Chart
This chart converts common A1C results into estimated average glucose in mg/dL and mmol/L, using the formula from the American Diabetes Association. The last column shows what each A1C level means for most adults.
| A1C (%) | eAG (mg/dL) | eAG (mmol/L) | What It Means |
|---|---|---|---|
| 5.0 | 97 | 5.4 | Normal |
| 5.5 | 111 | 6.2 | Normal |
| 5.7 | 117 | 6.5 | Prediabetes begins |
| 6.0 | 126 | 7.0 | Prediabetes |
| 6.4 | 137 | 7.6 | Prediabetes |
| 6.5 | 140 | 7.7 | Diabetes |
| 7.0 | 154 | 8.5 | Common goal for adults with diabetes |
| 7.5 | 169 | 9.3 | Above goal for most adults |
| 8.0 | 183 | 10.1 | High |
| 9.0 | 212 | 11.7 | High |
| 10.0 | 240 | 13.3 | Very high |
| 11.0 | 269 | 14.9 | Very high |
| 12.0 | 298 | 16.5 | Very high |
Take The First Step
Your health and wellness goals deserve expert attention. Our board-certified team is here to listen, evaluate, and build a care plan tailored to your unique needs. Whether you’re exploring your options or ready to get started, the next step is simple.
How to Convert A1C to Blood Sugar With the eAG Formula?
You can convert any A1C result yourself with a simple formula and a calculator. The two sections below show the formula in mg/dL, used in the United States, and in mmol/L, used in many other countries.
1. eAG Formula in mg/dL
The formula is eAG = 28.7 × A1C − 46.7. First, multiply your A1C number by 28.7. Then subtract 46.7. For example, if your A1C is 7.2 percent, multiply 7.2 by 28.7 to get 206.6. Subtract 46.7, and your estimated average blood sugar is about 160 mg/dL. You can use this formula for any A1C result, including decimals.
A quick shortcut also works. Start at 126 mg/dL for an A1C of 6 percent, then add about 29 mg/dL for each full point above 6. An A1C of 8 percent is about 126 plus 58, or 184 mg/dL. This mental math lands within a point or two of the exact formula and helps you read results quickly.
2. eAG Formula in mmol/L
In countries that use mmol/L, the formula is eAG = 1.59 × A1C − 2.59. For example, an A1C of 7 percent multiplied by 1.59 equals 11.13. Subtract 2.59, and the estimated average glucose is about 8.5 mmol/L. To change any mg/dL number into mmol/L, divide it by 18. To change mmol/L into mg/dL, multiply it by 18.
Some lab reports, especially outside the United States, show A1C in mmol/mol instead of a percentage. An A1C of 48 mmol/mol equals 6.5 percent, and 53 mmol/mol equals 7 percent. If your report uses mmol/mol, ask your provider to convert it to a percentage first. That makes the chart above easy to use with your own result.
What Your Converted Numbers Mean?
An A1C below 5.7 percent, or an eAG below 117 mg/dL, is normal. An A1C of 5.7 to 6.4 percent, or 117 to 137 mg/dL, is prediabetes. An A1C of 6.5 percent or higher, or 140 mg/dL or higher, is diabetes once a second test confirms it. Our guide on Normal A1C Level by Age explains how targets shift for older adults.
Most adults with diabetes aim for an A1C below 7 percent, which equals an average blood sugar of about 154 mg/dL. Daily targets are usually 80 to 130 mg/dL before meals and below 180 mg/dL one to two hours after eating. Our post on Normal Blood Sugar Levels by Age explains how these daily numbers fit together with your A1C.
Every drop in A1C matters for long term health. A drop in A1C from 8 percent to 7 percent brings your average blood sugar down by about 29 mg/dL and lowers the risk of eye, kidney, and nerve damage. Our guide on How to Lower Your A1C Naturally shows how diet, exercise, sleep, and weight loss can bring your numbers down.
Why Your A1C and Daily Readings Do Not Always Match?
eAG is an estimate, not an exact match for every person. In the original study, an A1C of 7 percent matched average blood sugars anywhere from about 123 to 185 mg/dL. Your daily finger stick readings can also miss spikes after meals and low readings during the night, which still count toward your A1C. A continuous glucose monitor gives a fuller picture of your true average.
Some health conditions change A1C without changing blood sugar. Iron deficiency anemia can make A1C read higher than your true average, while blood loss, recent transfusions, and some kidney problems can make it read lower. Pregnancy and sickle cell trait can also affect results. In these cases, your provider can use a fructosamine test or a continuous glucose monitor instead.
At Prime Healthcare of Cypress, we review your A1C, eAG, and home readings together and explain what your numbers mean in plain language. Our chronic disease management in Cypress covers diabetes care and medication changes. A1C tests are part of annual physical exams in Cypress, and telemedicine in Cypress makes it easy to review your results from home.
Frequently Asked Questions
Take The First Step
Your health and wellness goals deserve expert attention. Our board-certified team is here to listen, evaluate, and build a care plan tailored to your unique needs. Whether you’re exploring your options or ready to get started, the next step is simple.